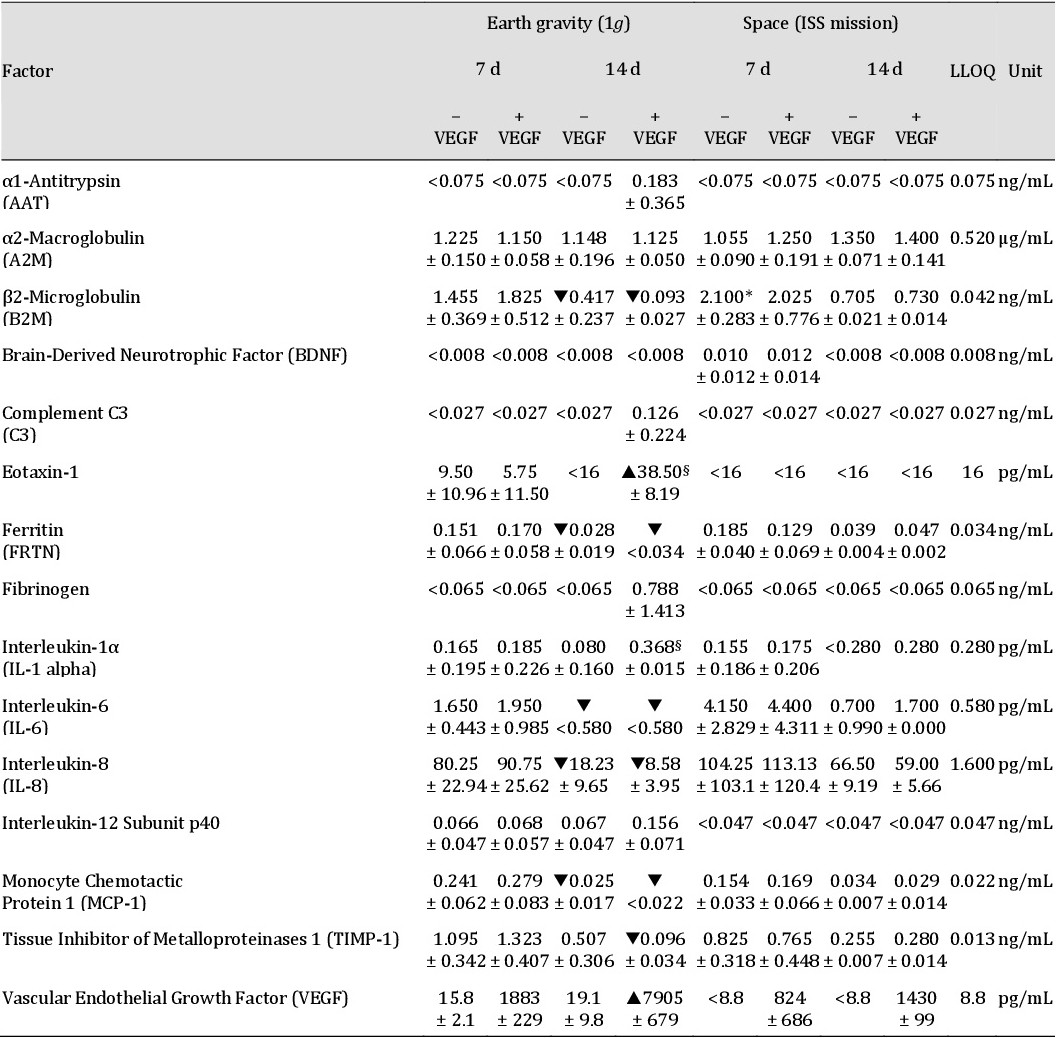
Table 4. Proteins released by EA.hy926 cells after space-exposure compared with 1g controls. The cells were cultured in CCs of the flight hardware. The data was generated by Multi-Analyte Profiling using the Myriad RBM Human Inflammation MAP(r) v1.0. Values are given as mean ± SD; *: P <0.05 vs. 1g; ▼|▲: P <0.05 vs. 7d§: P <0.05 vs. −VEGF; LLOQ: Lower Limit of Quantitation, lowest concentration of an analyte in a sample that can be reliably detected. The values are determined as the mean of 5 (1g control) or 13 (RPM) blank readings. C-Reactive Protein (CRP), Factor VII, Granulocyte-Macrophage Colony-Stimulating Factor (GM-CSF), Haptoglobin, Intercellular Adhesion Molecule 1 (ICAM-1), Interferon γ (IFN-γ), Interleukin-1 beta (IL-1β), Interleukin-1 receptor antagonist (IL-1ra), Interleukin-2 (IL-2), Interleukin-3 (IL-3), Interleukin-4 (IL-4), Interleukin-5 (IL-5), Interleukin-7 (IL-7), Interleukin-10 (IL-10), Interleukin-12 Subunit p70 (IL-12p70), Interleukin-15 (IL-15), Interleukin-17 (IL-17), Interleukin-18 (IL-18), Interleukin-23 (IL-23), Macrophage Inflammatory Protein-1α (MIP-1α), Macrophage Inflammatory Protein-1β (MIP-1β), Matrix Metalloproteinase-3 (MMP-3), Matrix Metalloproteinase-9 (MMP-9), Stem Cell Factor (SCF), T-Cell-Specific Protein RANTES (RANTES), Tumor Necrosis Factor α (TNF-α), Tumor Necrosis Factor β (TNF-β), Tumor Necrosis Factor Receptor 2 (TNFR2), Vascular Cell Adhesion Molecule-1 (VCAM-1), Vitamin D-Binding Protein (VDBP), and von Willebrand Factor (vWF) levels were below the LLOQ